
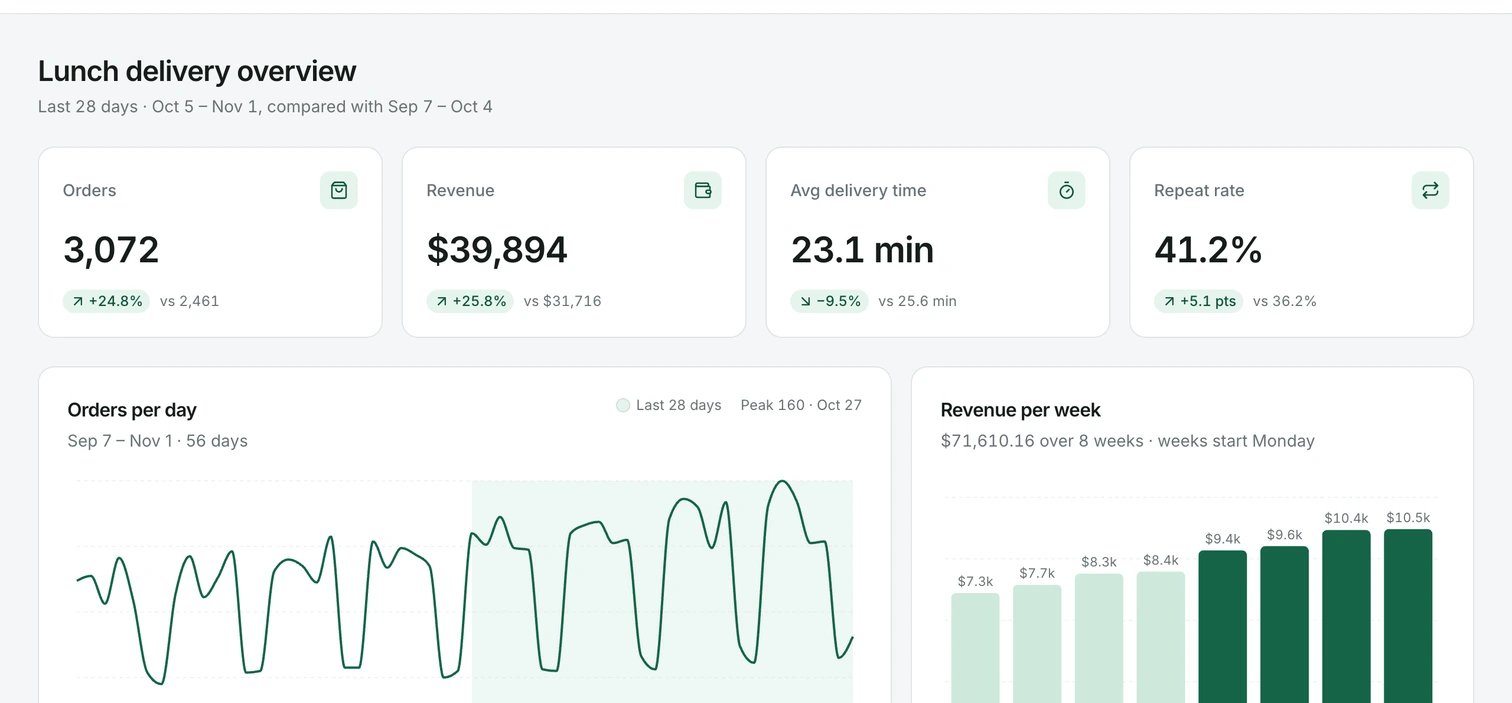
What you end with. Every number here comes from the attached file.
- Who it is for: anyone with a data export who needs a dashboard other people can open.
- What it costs: the run below used 58 credits and took about three minutes. Every organization gets 500 free credits every 30 days.
- What you need: a CSV up to 500 KB. To follow along with ours, download fresh-bowl-orders.csv: 56 rows and five columns (date, orders, revenue, average delivery minutes, repeat customers).
1. Attach the file
On the projects page, click the file icon at the bottom left of the prompt input and choose your CSV. You can also drag the file onto the input, which shows Drop files to attach. A prompt takes up to 3 PDFs or text files, and each text file can be up to 500 KB. If your export is bigger, cut it to the rows and columns the dashboard needs.2. Say what the dashboard shows
Name each card and chart, the period it covers and what to compare it with. The agent reads the file, so use the words your columns use.3. Check the numbers
A dashboard that looks right and is wrong is worse than none. Before you share it, check two or three numbers against the file yourself. For this run, we added up the last 28 rows of the file:
Three matched. The fourth was off by a tenth of a minute, and the reason is worth knowing: the agent weighted each day’s delivery time by that day’s orders, so busy days count for more. Weighted that way the file gives 23.1 too. Both are defensible. If you want one of them, say which in the prompt.
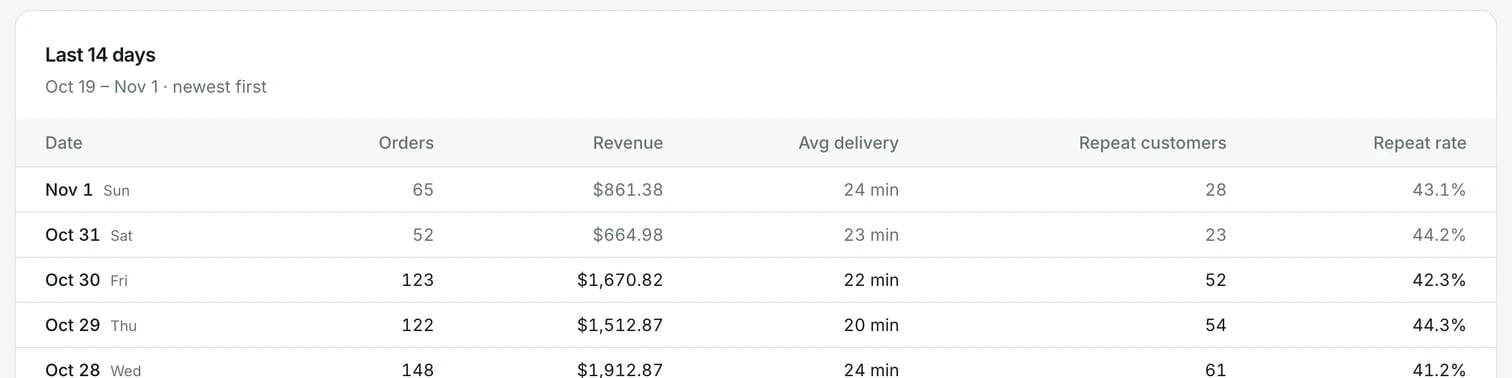
The table under the charts shows the rows themselves, which makes spot checks quick.
4. Adjust it
- One element: click Select, click it and write the change, for example “show this axis in weeks”.
- The layout: say it in a prompt: “Put the two charts side by side on wide screens and stacked on a phone.”
- Other widths: open the page in Focus, click Breakpoints and check Mobile view and Tablet view.
5. Publish
Click Publish in the canvas header, then Publish in the popover. When it says Published, copy the live link. Anyone with the link can open the dashboard. A published dashboard shows the data that was in the file. It does not update when your data changes. To keep live data, add a backend and ask the agent to read from a table.You’re done when
- Two numbers you checked by hand match the file.
- The live link opens in a private browser window.
- The page is readable at Mobile view width.
If it goes wrong
- The numbers look made up. Send: “Recalculate every number from the attached CSV and show me the formula for each card.”
- The input says “Attachments are too large to fit the model’s context — remove one or use smaller files.” Cut the file down, or split it and attach the part you need.
- The Publish popover says “There are no prototypes yet”. Click Create a prototype and send the draft it puts in the prompt input.
Next
- Prompt the agent: everything you can attach, and the limits
- Compare options side by side: try two chart layouts and pick one
- Add a backend: read the numbers from a table that changes
- Publish a prototype: update, rename or unpublish the live link